Graphite Beacon
By Miha Hribar | | 2 minute read
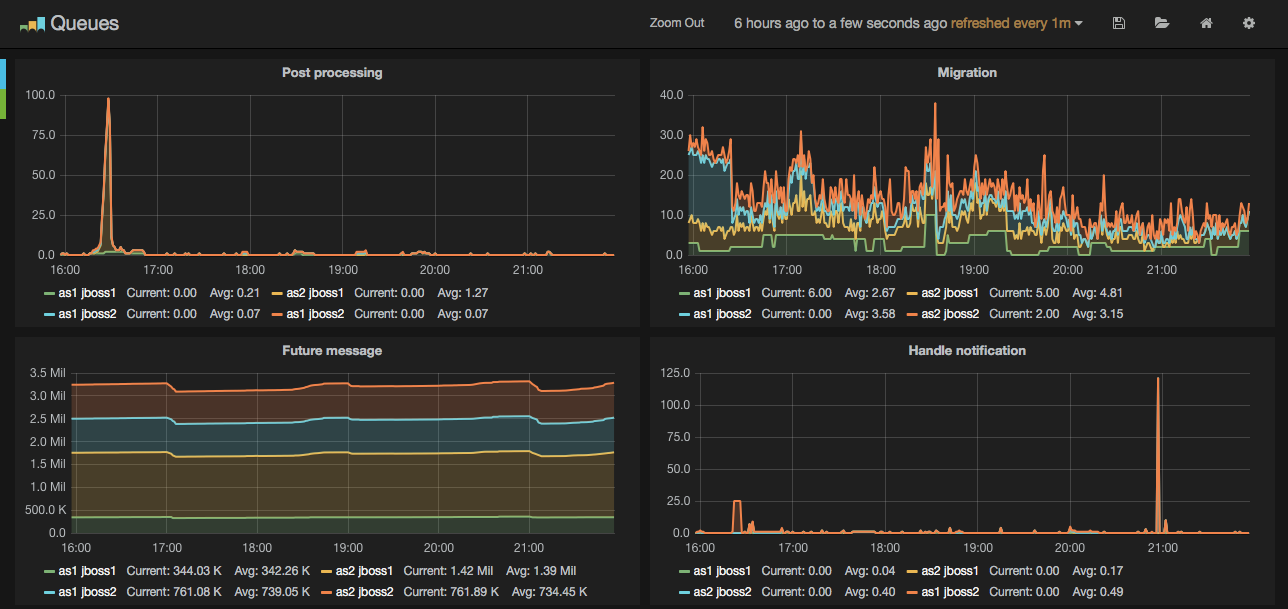
At Toshl we use Statsd, Graphite and Grafana to keep an eye on what is going on with our system. It has served us nicely thus far and allowed us to find a number of issues.
The thing that was missing in our setup was an alerting system, that could post to our HipChat chat and send an email if things start to go south. After trying out Newrelic and DataDog for a couple of weeks I found them to be lacking in what our metrics already had, specificity to our system. We’ve built a comprehensive suite of metrics and dashboards, so why not use that in the first place.
Enter graphite-beacon, a simple alerting system for Graphite metrics. It’s easy to setup and configure. You basically just point it to your graphite instance, setup the metrics you wish to monitor and set the alerting threasholds for normal, warning and critical states for each metric. It has a number of handlers like email, hipchat, slack, pager duty and others, but if you find something is missing, extending it looks pretty straightforward.
![]()
The nice thing about it is that it knows about historical values and can use that knowledge to generate alerts in case of something statistically significant is happening.
{
  alerts: [
    {
      "name": "Registrations",
      // Run once per day
      "interval": "1day",
      "query": "Your graphite query here",
      // Get average for last 10 days
      "history_size": "10day",
      "rules": [
        // today's new user less than 80% of average for 10 days
        "warning: < historical * 0.8",
        // today's new user less than 50% of average for 10 days
        "critical: < historical * 0.5"
      ]
    }
  ]
}
So in order to know what is happening with your system you push it into graphite, create a dashboard in grafana and setup an alert with beacon. Neat. Hope you find it useful too.
Note: Yeah server names are from the Battlestar Galactica universe. What can I say, the sci-fi junkie in me couldn’t resist.